
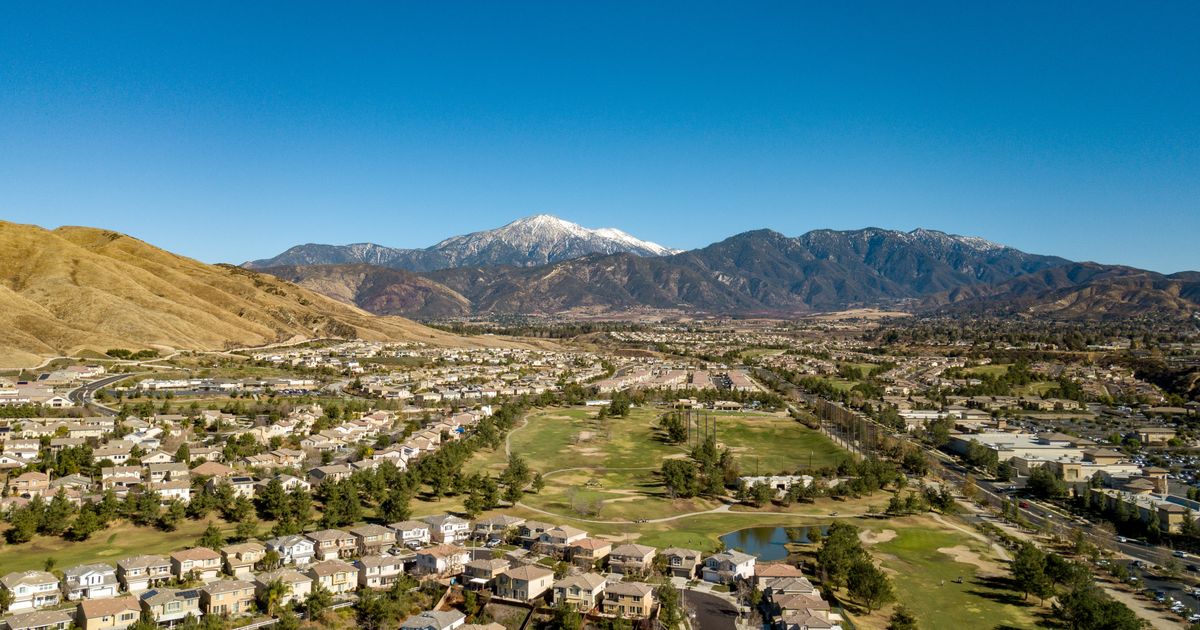
The San Bernardino County Housing Market: Prices, Inventory and Days on Market (2026)
By Chris Leeper, REALTOR®, DRE #01881634 · Leeper Realty Group
What is the San Bernardino County housing market doing in 2026? Prices are holding and sales are slower. The county median was up 1.9% from a year earlier in October 2026, sales fell 12.5%, and buyers have more homes to choose from than in Riverside County or the state as a whole.
This page collects the current San Bernardino County numbers in one place and explains what they mean. The snapshot box is updated each month when the California Association of REALTORS® releases new county data. Everything else on the page explains how to read it.
San Bernardino County is the other half of the Inland Empire, and it's where a lot of my clients look when they compare prices, commutes and space. I've closed more than 100 sales here since 2013, most of them helping buyers, from Redlands, Yucaipa and San Bernardino out to Victorville and Apple Valley.
I was born and raised in Moreno Valley and have been selling homes across the Inland Empire since 2010, with over 400 homes sold. Most of that work is in Riverside County, which has its own Riverside County market page. This one covers the county next door.
Where the market stands right now
San Bernardino County snapshot
Figures current as of October 2026. Every dated number on this page is from this snapshot.
Median sold price, existing single-family home: $501,510
Down 5.6% from September 2026. Up 1.9% from October 2025.
Home sales: down 12.5% from October 2025.
Months of supply (Unsold Inventory Index): 5.3 months, up from 4.6 in October 2025.
Median days to sell (homes that sold): 37 days, down from 46 in October 2025.
Source: California Association of REALTORS® October 2026 sales and price report.
Median days on market (all listings): 67 days, up from 65 in September 2026.
Counts every listing, including ones that went off the market without selling.
Source: Realtor.com residential listing data via FRED, October 2026.
For comparison, October 2026: Riverside County median $610,000, down 3.9% from October 2025, with 4.8 months of supply. Inland Empire median $577,440, down 3.7%. California statewide median $886,760 with 3.8 months of supply. Source: C.A.R.
Across the county, October 2026 (median sold price and median days on market, all residential sales, from my CRMLS pull):
- Rancho Cucamonga: $751,000, 25 days
- Redlands: $635,000, 30 days
- Yucaipa: $574,495, 23 days
- San Bernardino: $502,500, 23 days
- Apple Valley: $461,500, 34 days
- Hesperia: $440,000, 30 days
- Victorville: $435,000, 28 days
City medians move around month to month on smaller numbers of sales, so read them as a range rather than a precise price.
Two things stand out. Prices are up from a year ago while Riverside County's are down, and San Bernardino County has more supply than its neighbor while its sold homes are closing faster.
Is it a buyer's market or a seller's market?
San Bernardino County sits closer to the buyer's side than Riverside County does. The Unsold Inventory Index measures how many months it would take to sell every home on the market at the current pace of sales. At 5.3 months, the county has more supply than Riverside County, more than the state, and more than it had a year ago.
In practice that means buyers have time to compare homes and room to ask for things. Sellers still do well when the price matches the market, and the homes that sell are going under contract faster than they did a year ago. The ones that sit are usually priced for last year.
For the full argument, read whether it's a buyer's market in the Inland Empire.
What are home prices doing?
Over the past year, San Bernardino County prices have held up better than Riverside County's. The county median rose 1.9% from a year earlier, while Riverside County's fell 3.9% and the Inland Empire as a whole fell 3.7%, according to the same C.A.R. report. Month-to-month moves like the 5.6% dip from September often reflect which homes happened to sell that month. The year-over-year number is the better read.
The bigger story is the price gap. The county median sits about $108,000 below Riverside County's and about $385,000 below the statewide median. That gap is a big part of why buyers priced out closer to the coast keep looking east.
Where do prices fall across San Bernardino County?
San Bernardino County is the largest county in the lower 48 states by land area, so one county median hides a wide range. The city list in the snapshot shows how wide.
The highest prices are along the western end of the valley, in cities like Rancho Cucamonga. Redlands and Yucaipa on the east end come in below that, and the city of San Bernardino sits close to the county median. Up the Cajon Pass, the High Desert cities of Victorville, Hesperia and Apple Valley have the lowest prices in the list, and that's where a budget goes the furthest.
If you're comparing cities across both counties, the price you see is only part of it. Commute, lot size, the age of the homes and any Mello-Roos or HOA on the property all change what a home really costs you each month.
For how last winter played out city by city, including Redlands and San Bernardino next to eight Riverside County cities, read holiday house hunting in the Inland Empire.
How long are homes taking to sell?
It depends on which number you use, and in San Bernardino County the difference between them is wide.
C.A.R. reports a median of 37 days for homes that sold, faster than a year ago. Realtor.com reports a median of 67 days for all listings, including homes that were pulled off the market without selling. That's a gap of about a month. The homes that sell are selling in about five weeks. The homes that don't are pulling the second number up.
That lines up with what I see in my own listings in Riverside County, where homes that went under contract in the first two weeks sold much closer to their original list price than homes that sat past 90 days. The details are on the Riverside County market page.
For sellers, the lesson is to price for the first two weeks. For buyers, a home that has sat well past the county median is often the one with room to negotiate. The Seller pillar and the Buyer pillar each go deeper on their side of that.
How are interest rates affecting the market?
Rates shape the market mostly through volume. When rates are higher than the rate most owners already have, fewer of them choose to sell and fewer buyers qualify for the same payment, so both sides of the market get thinner. That shows up in the 12.5% drop in county sales from a year ago more than it shows up in price.
I don't print a mortgage rate on this page because rates move weekly. Get a current quote from your lender.
If you're waiting for rates to fall before you buy or sell, waiting for interest rates to drop might be a mistake lays out what tends to happen when they do.
How are buyers and sellers negotiating right now?
With more than five months of supply, buyers here are asking for more than a lower price. Seller credits toward closing costs, repair credits after inspection and rate buydowns are all part of the conversation, and how the buyer is paying changes what's realistic. In my experience, FHA and VA buyers ask for closing cost help more often than conventional or cash buyers do.
For sellers, the strongest position is a home that's priced right and ready on day one, so the negotiation starts from a good offer instead of a reduction.
What does this mean for you?
If you're selling, this market rewards preparation and accurate pricing from day one. Start with our complete guide to selling a home, or request a home value estimate for your address.
If you're buying, you have more homes to choose from here than in Riverside County, and more room to negotiate on homes that have been sitting. Start with our complete guide to buying a home in the Inland Empire, and read should you buy now or wait if timing is the question.
If you're comparing both counties, the Riverside County market page has the same numbers for the other half of the Inland Empire.
Find out what your home is worth. Call or text 951-741-5311.
This content is for general information only and is not legal, tax or financial advice. Market figures come from the sources named, reflect the date shown, and may change. Talk with a qualified attorney, tax professional or lender about your specific situation. Equal Housing Opportunity.
Frequently Asked Questions
Are home prices going down in San Bernardino County?
Not over the past year. The county median was up 1.9% from a year earlier as of October 2026, even though it dipped from September. Month-to-month moves often reflect the mix of homes that sold. The current figures are in the snapshot at the top of this page.
How much inventory is there in San Bernardino County?
C.A.R.'s Unsold Inventory Index puts the county at 5.3 months of supply as of October 2026, more than Riverside County (4.8 months) and the state (3.8 months). That gives buyers more homes to compare and more time to decide.
Is San Bernardino County cheaper than Riverside County?
Yes, on the county median. In October 2026 the San Bernardino County median for an existing single-family home was $501,510, against $610,000 in Riverside County, according to C.A.R. Prices vary widely inside the county, from the High Desert to the cities along the 210.
Why do different websites show different days on market?
They measure different things. C.A.R. measures homes that sold. Realtor.com measures all listings, including ones that came off the market without selling, so its number runs higher.
How often is this page updated?
The snapshot is updated monthly after C.A.R. releases its county data, usually in the third week of the following month.
Chris Leeper, REALTOR® | DRE #01881634 | Leeper Realty Group
Brokered by eXp Realty of California, Inc.